GHGRP Waste
 The waste sector consists of municipal solid waste (MSW) landfills, industrial waste landfills, industrial wastewater treatment systems, and facilities that operate combustors or incinerators for the disposal of nonhazardous solid waste. Emissions from fossil fuel combustion at facilities with industrial waste landfills, and industrial wastewater treatment systems are included in other sectors.
MSW landfills. This category consists of landfills that accepted MSW on or after January 1, 1980 and generate methane in amounts equivalent to 25,000 metric tons of CO2e or more per year. This category includes emissions from the landfill, landfill gas collection systems, and destruction devices for landfill gases (including boilers, engines, and flares).
Industrial Waste Landfills. This category consists of industrial waste landfills that accepted industrial waste on or after January 1, 1980 and that have a total landfill design capacity of 300,000 metric tons or more. The category excludes landfills for hazardous waste and those that receive only construction and demolition or inert wastes. This category includes emissions from the landfill, landfill gas collection systems, and destruction devices for landfill gases (including flares).
Industrial Wastewater Treatment. This category consists of anaerobic processes used to treat nonhazardous industrial wastewater and industrial wastewater treatment sludge at facilities that perform pulp and paper manufacturing, food processing, ethanol production, or petroleum refining.
Solid Waste Combustion. This category consists of combustors and incinerators for the disposal of nonhazardous solid waste.
- 2015 Total Reported Direct Emissions from Waste, by Subsector (as of 8/13/16).
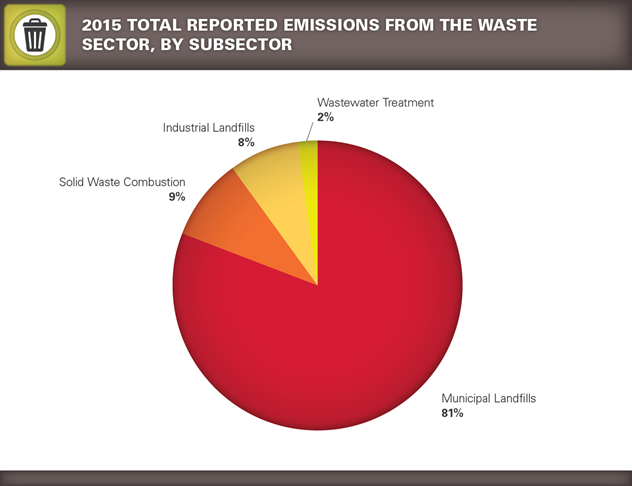
Sum of percentages may not equal 100% due to independent rounding.
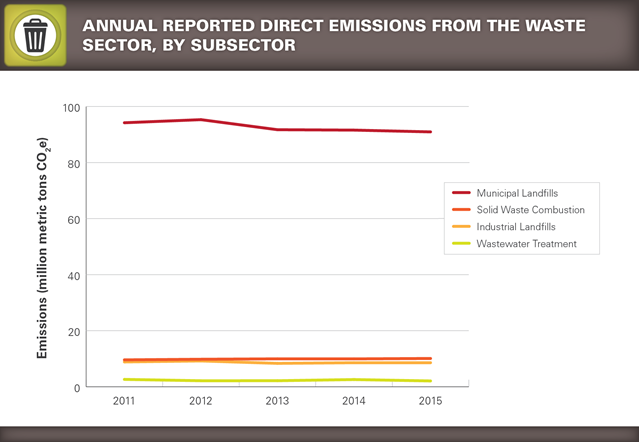
- Trend of Annual Reported GHG Emissions by Subsector (as of 8/13/16).
- Location and emissions range for each reporting facility in the waste sector (as of 8/13/16).
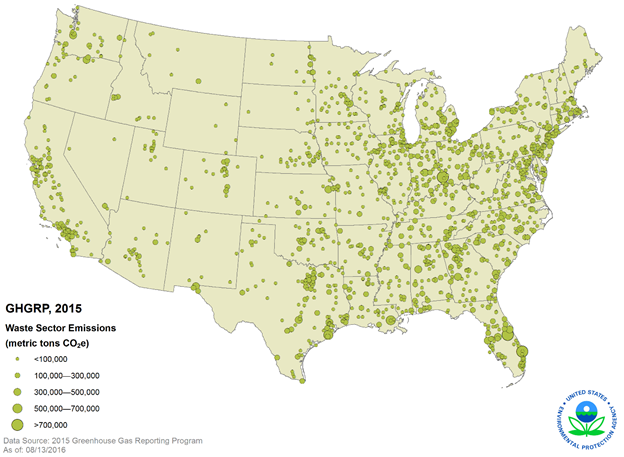
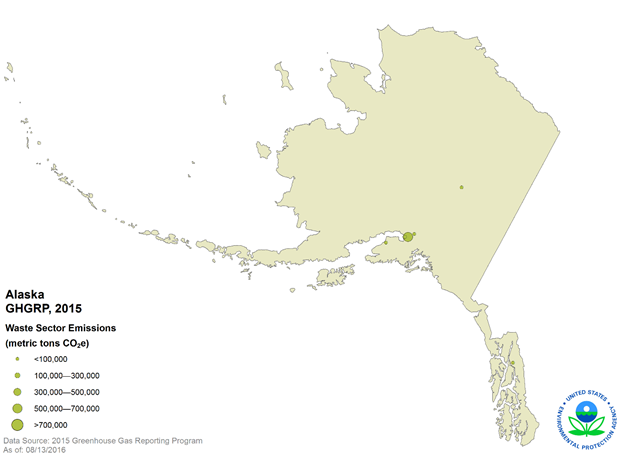
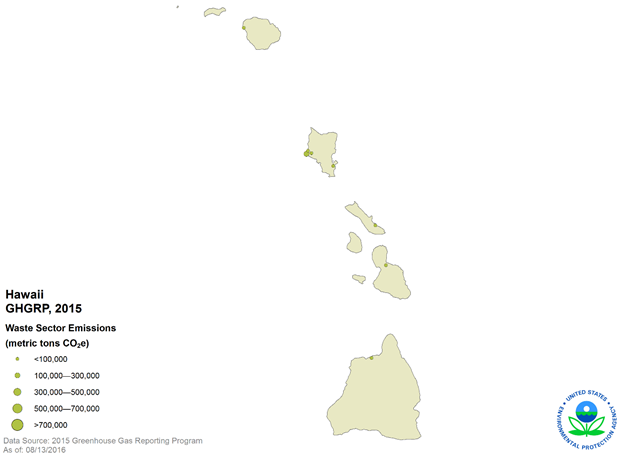
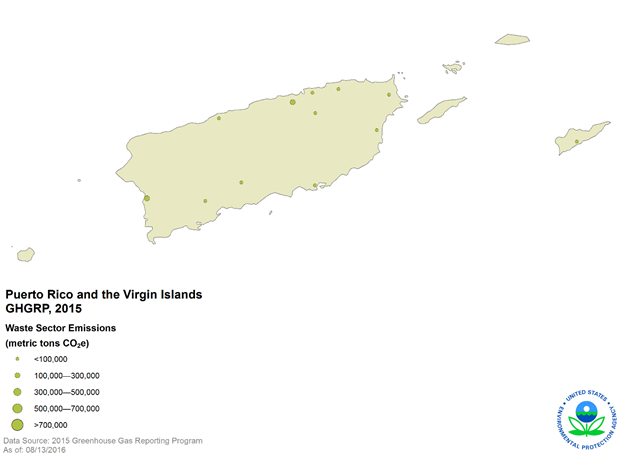
This map shows the locations of direct-emitting facilities. The size of a circle corresponds to the quantity of emissions reported by that facility.
| Waste Sector — Greenhouse Gas Emissions Reported to the GHGRP (all emissions values presented in million metric tons CO2e) |
|||||
| 2011 | 2012 | 2013 | 2014 | 2015 | |
|---|---|---|---|---|---|
| Number of facilities: | 1,643 | 1,648 | 1,631 | 1,625 | 1,540 |
| Total emissions (CO2e): | 115.3 | 116.5 | 112.2 | 112.6 | 111.7 |
| Emissions by greenhouse gas (CO2e)
|
10.1 104.8 0.4 |
10.3 105.8 0.4 |
10.5 101.3 0.4 |
10.6 101.7 0.4 |
10.8 100.5 0.4 |
Totals may not equal sum of individual GHGs due to independent rounding.
CO2 emissions from the combustion of biomass are NOT included in emissions totals provided above.
| Number of reporters and 2015 emissions (CO2e) per waste industry subsector | ||
| Industry Sector | 2015 Number of Reporters | 2015 Emissions (million metric tons CO2e per year) |
|---|---|---|
| MSW Landfills | 1,161 | 91.0 |
| Industrial Wastewater Treatment | 148 | 2.1 |
| Industrial Waste Landfills | 174 | 8.6 |
| Solid Waste Combustion | 64 | 10.1 |
