GHGRP Petroleum and Natural Gas Systems
 This sector consists of the following industry segments of the petroleum and natural gas industry.
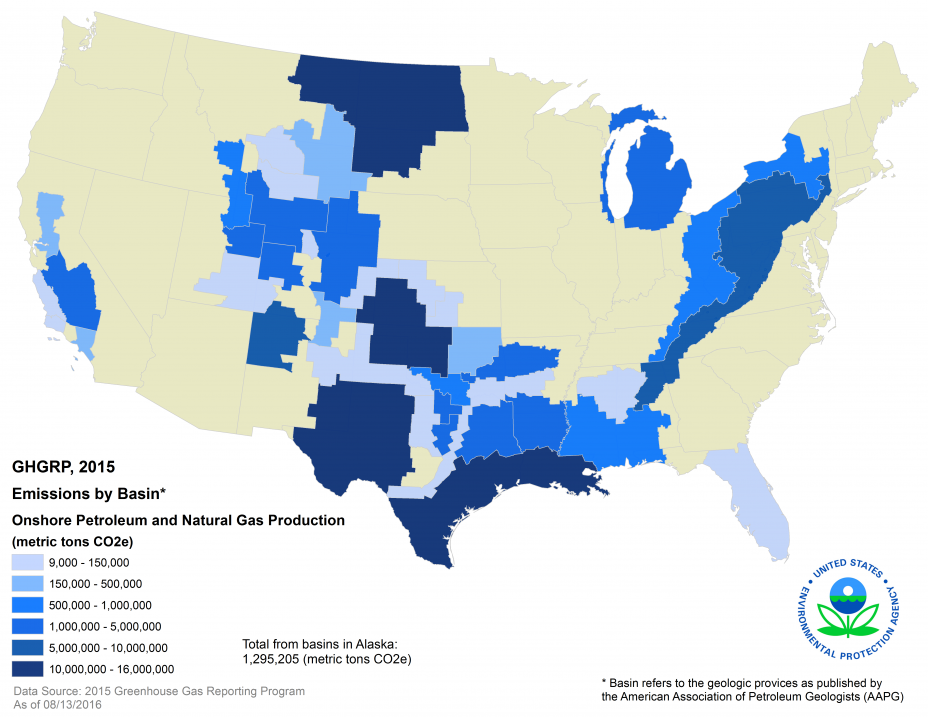
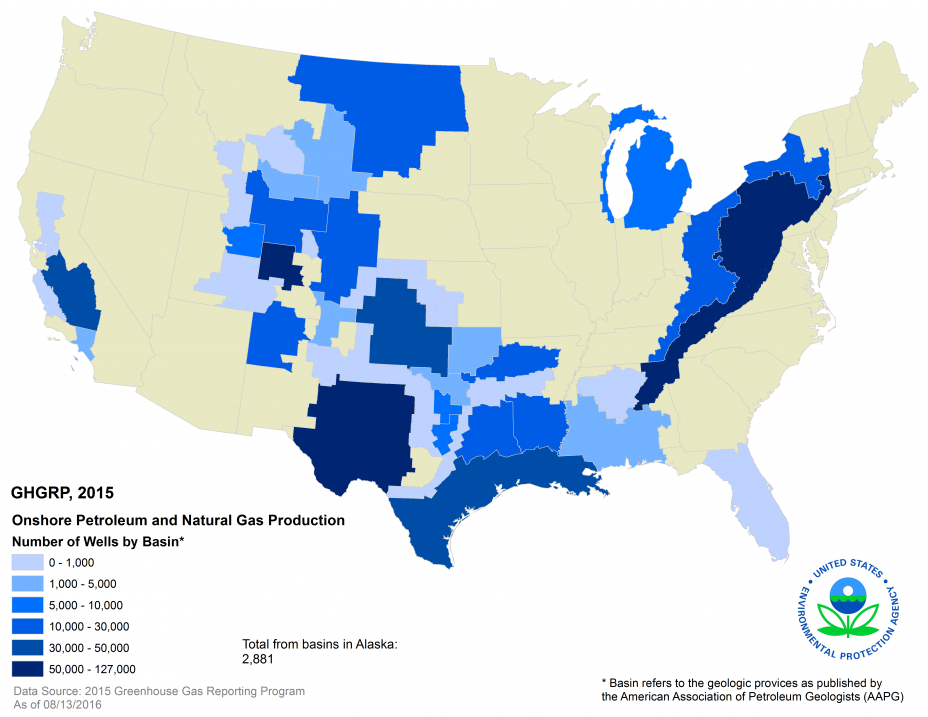
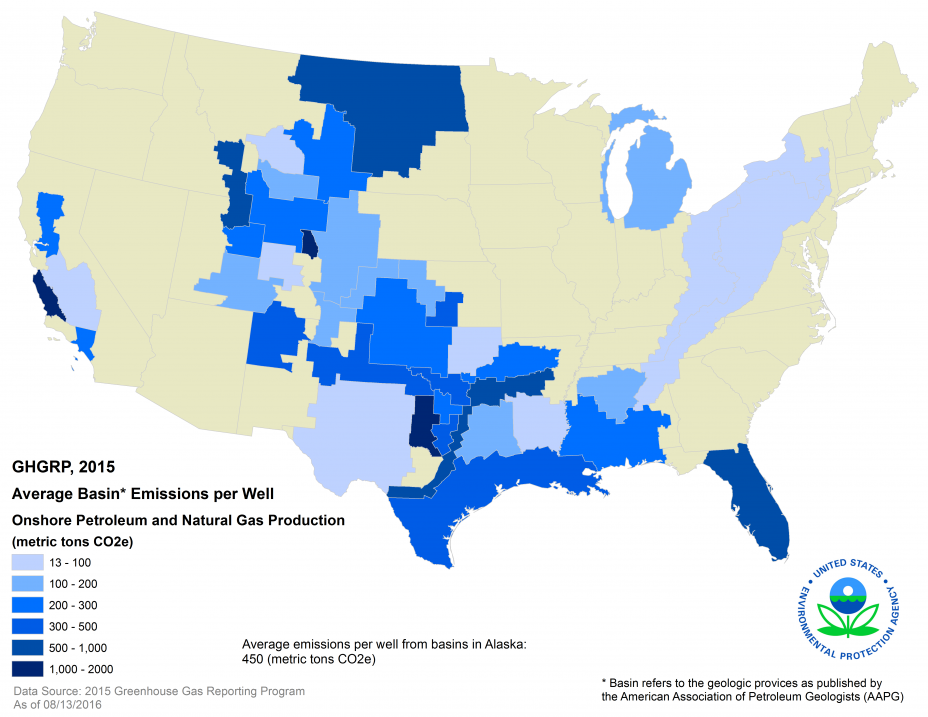
- Onshore Production. Production of petroleum and natural gas associated with onshore production wells and related equipment.
- Offshore Production. Production of petroleum and natural gas from offshore production platforms.
- Natural Gas Processing. Processing of field quality gas to produce pipeline quality natural gas.
- Natural Gas Transmission. Compressor stations used to transfer natural gas through transmission pipelines.
- Underground Natural Gas Storage. Facilities that store natural gas in underground formations.
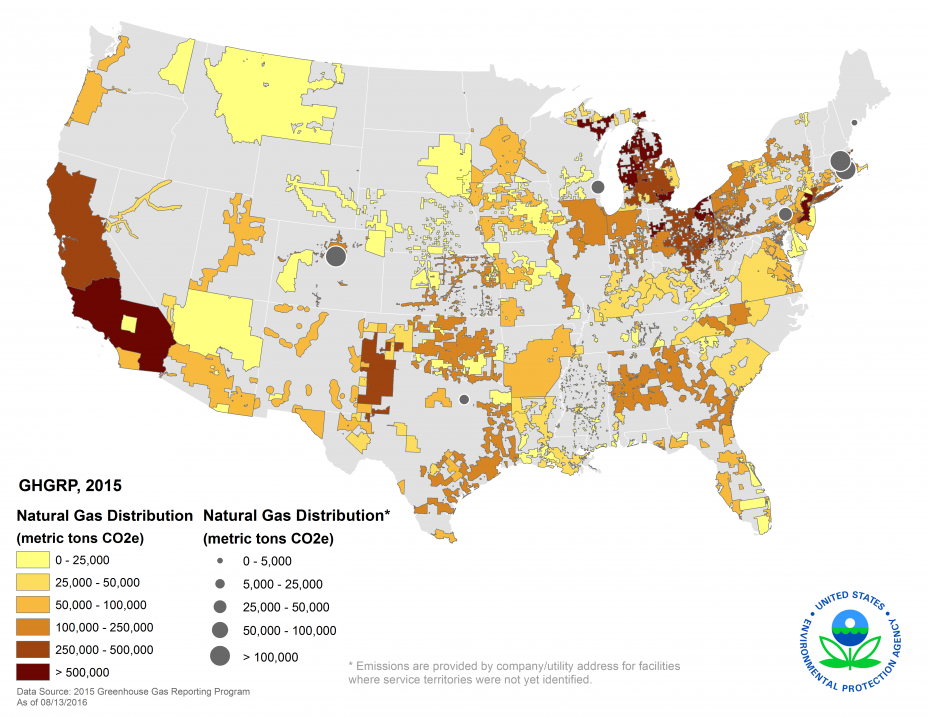
- Natural Gas Distribution. Distribution systems that deliver natural gas to customers.
- Liquefied Natural Gas (LNG) Import/Export. Liquefied Natural Gas import and export terminals.
- LNG Storage. Liquefied Natural Gas storage equipment.
- Other Petroleum and Natural Gas Systems. Stationary fuel combustion emissions from petroleum and natural gas source categories that are not otherwise listed.
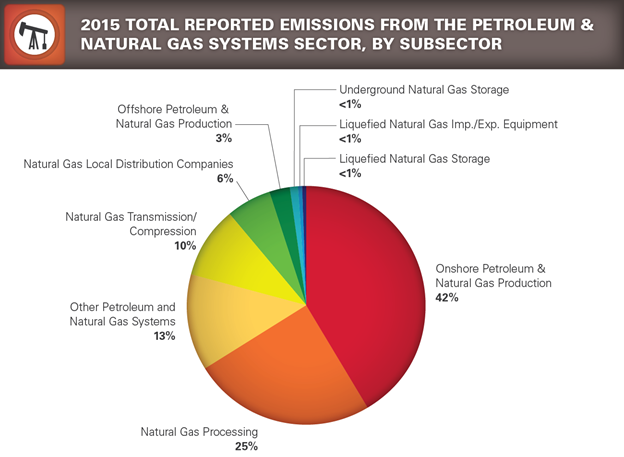
- 2015 Total Reported Direct Emissions from Petroleum and Natural Gas Systems, by Subsector (as of 8/13/16)
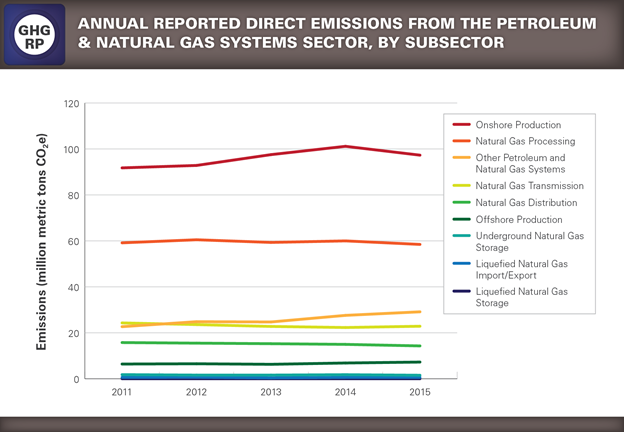
- Trend of Annual Reported GHG Emissions for Petroleum and Natural Gas Systems (as of 8/13/16)
| Petroleum and Natural Gas Systems Sector — Greenhouse Gas Emissions Reported to the GHGRP (all emissions values presented in million metric tons CO2e) |
|||||
|---|---|---|---|---|---|
| 2011 | 2012 | 2013 | 2014 | 2015 | |
| Number of facilities: | 1,922 | 2,094 | 2,186 | 2,416 | 2,413 |
| Total emissions (CO2e): | 222.3 | 226.0 | 227.8 | 235.1 | 231.4 |
| Emissions by greenhouse gas (CO2e)
|
138.4 83.8 0.1 |
145.4 80.1 0.4 |
150.6 77.1 0.1 |
161.9 73.1 0.1 |
160.5 70.3 0.6 |
Totals may not equal sum of individual GHGs due to independent rounding.
CO2 emissions from the combustion of biomass are NOT included in emissions totals provided above.
| Industry Sector | 2015 Number of Reporters | 2015 Emissions (million metric tons CO2e) |
|---|---|---|
| Onshore Production | 534 | 97.3 |
| Offshore Production | 133 | 7.3 |
| Natural Gas Processing | 467 | 58.5 |
| Natural Gas Transmission/Compression | 521 | 22.9 |
| Underground Natural Gas Storage | 53 | 1.51 |
| Natural Gas Local Distribution Companies | 177 | 14.3 |
| Liquefied Natural Gas (LNG) Import/Export | 7 | 0.6 |
| LNG Storage | 7 | ** |
| Other Petroleum and Natural Gas Systems | 541 | 29.1 |
Totals may not equal sum of individual GHGs due to independent rounding.
** Total reported emissions are less than 0.05 million metric tons CO2e.
1 The Southern California Gas Company - Aliso Canyon facility’s actual 2015 emissions were higher than those reported to the GHGRP. The GHGRP provides well-vetted average emission factors to calculate emissions. The facility followed these GHGRP calculation methods for 2015 reporting. Actual emissions differ from those reported due to an exceptional leak event. See California Air Resource Board’s Aliso Canyon Natural Gas Leak Exitwebpage for more information.
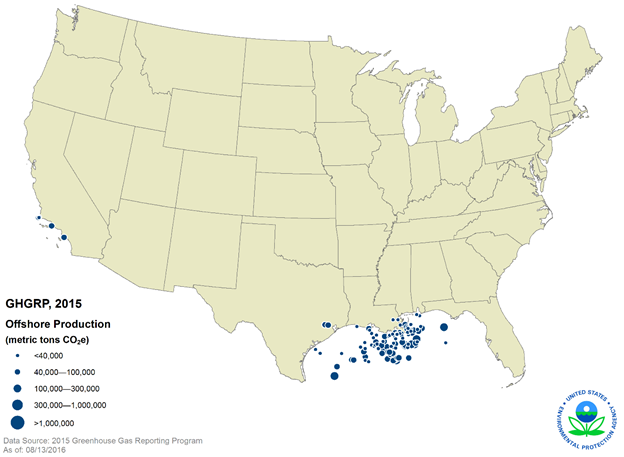
- Facility locations and reported emissions (CO2e) for offshore production
- Reported emissions (CO2e) and well count by geologic basin for onshore production facilities
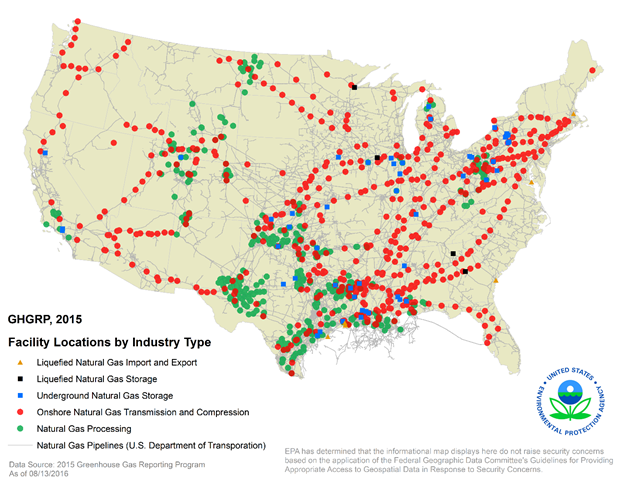
- Reported emissions (CO2e) by facility for industry types: natural gas processing, natural gas transmission/compression, underground natural gas storage, LNG storage, LNG import/export
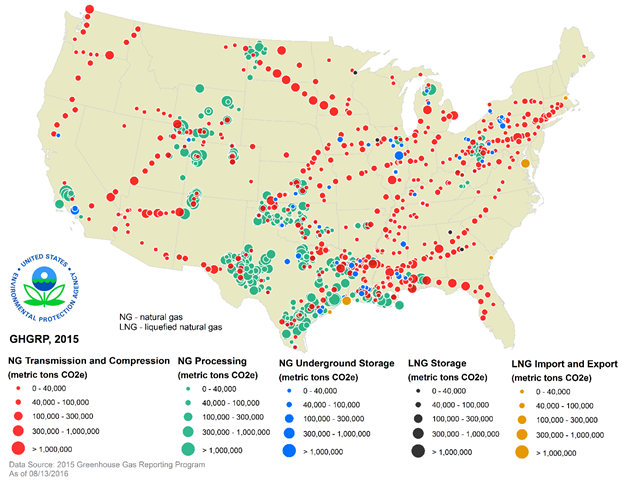
- Facility locations for industry types: natural gas processing, natural gas transmission, underground natural gas storage, LNG storage, LNG import/export
- Reported emissions (CO2e) by natural gas utility service territory for natural gas distribution facilities
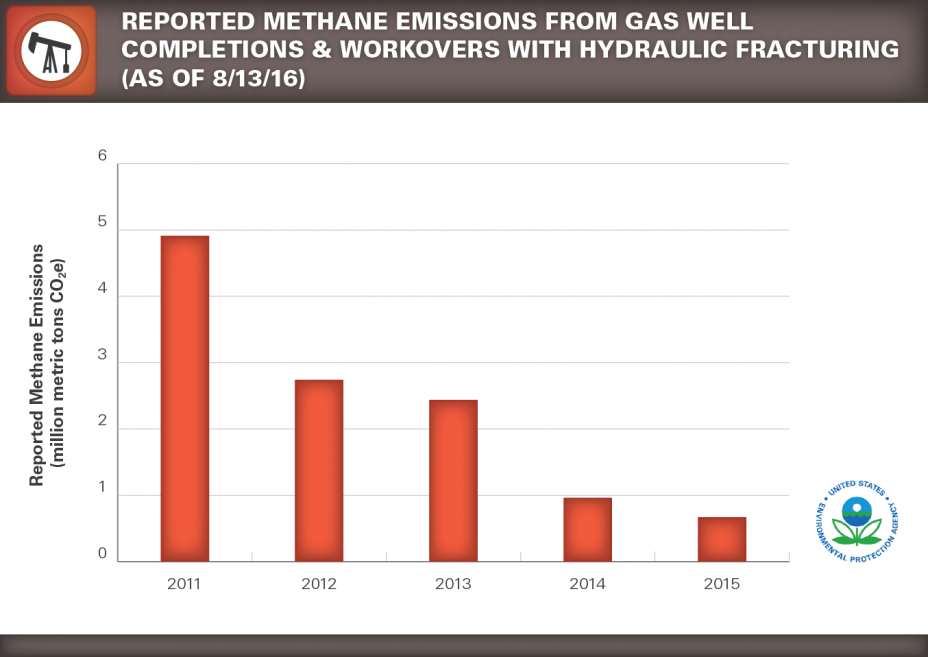
- Reported methane emissions (CO2e) for gas well completions and workovers with hydraulic fracturing.

