GHGRP Pulp and Paper
 The pulp and paper sector consists of facilities that produce market pulp or that manufacture pulp and paper. Facilities that have pulping processes report the GHG emissions from chemical recovery units, lime kilns, and stationary fuel combustion units. In addition to emissions from pulp production processes, the sector includes combustion emissions from facilities that produce paper products from purchased pulp, produce secondary fiber from recycled paper, convert paper into paperboard products, operate coating and laminating processes, print products (such as books, labels, business cards, stationery, and business forms), and perform support activities (such as data imaging, plate-making services, and bookbinding). Emissions from industrial landfills and industrial wastewater treatment at facilities in the pulp and paper sector are included in the waste sector.
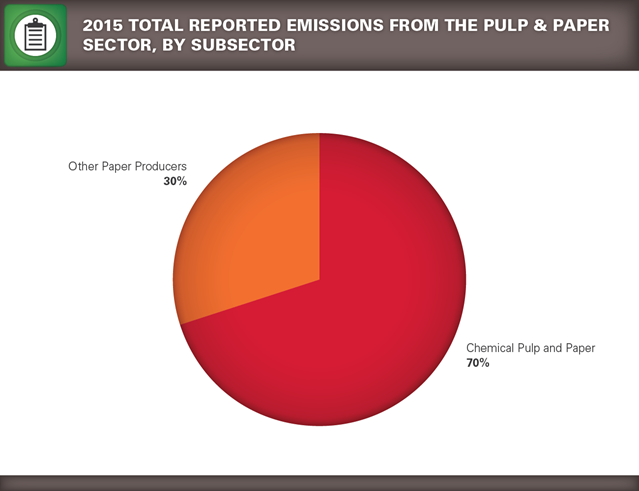
- 2015 Total Reported Direct Emissions from Pulp and Paper, by Subsector (as of 8/13/16).

Sum of percentages may not equal 100% due to independent rounding.
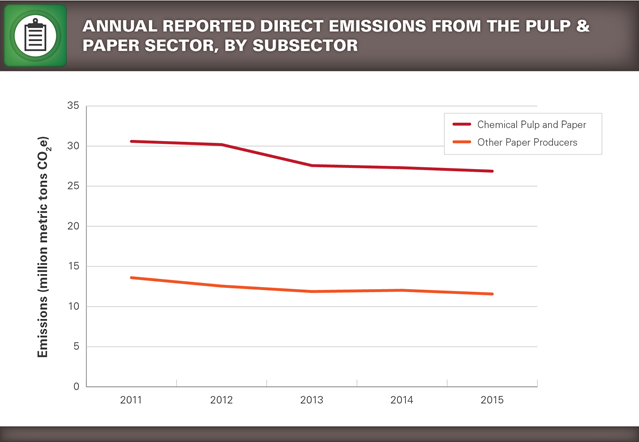
- Trend of Annual Reported GHG Emissions by Subsector (as of 8/13/16)

Emissions from the pulp and paper sector declined from 2012 to 2013 in part due to a change in the emission factors used to estimate GHG emissions from the combustion of spent pulping liquor and wood residuals. For more information, please click here.
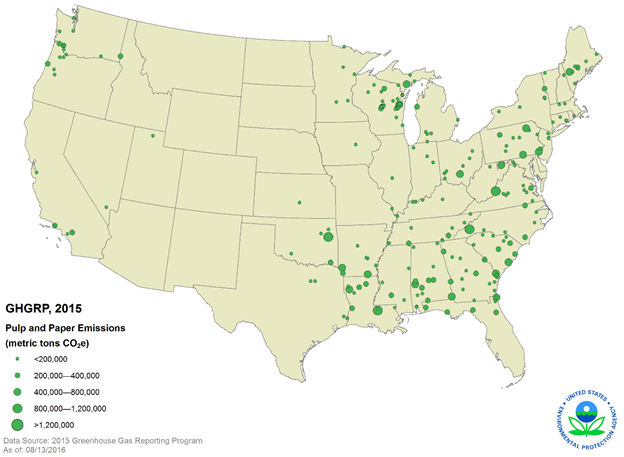
- Location and emissions range for each reporting facility in the pulp and paper sector (as of 8/13/16).

This map shows the locations of direct-emitting facilities. The size of a circle corresponds to the quantity of emissions reported by that facility.
| Pulp and Paper Sector — Greenhouse Gas Emissions Reported to the GHGRP (all emissions values presented in million metric tons CO2e) |
|||||
| 2011 | 2012 | 2013 | 2014 | 2015 | |
|---|---|---|---|---|---|
| Number of facilities: | 233 | 232 | 233 | 234 | 232 |
| Total emissions (CO2e): | 44.2 | 42.7 | 39.4 | 39.3 | 38.4 |
| Emissions by greenhouse gas (CO2e)
|
41.2 1.1 1.9 |
39.8 1.1 1.9 |
38.6 0.2 0.6 |
38.5 0.2 0.6 |
37.7 0.2 0.6 |
Totals may not equal sum of individual GHGs due to independent rounding.
CO2 emissions from the combustion of biomass are NOT included in emissions totals provided above.
| Number of reporters and 2015 emissions (CO2e) per pulp and paper industry subsector | ||
| Industry Sector | 2015 Number of Reporters | 2015 Emissions (million metric tons CO2e) |
|---|---|---|
|
|
|
