Sources of Greenhouse Gas Emissions
Overview
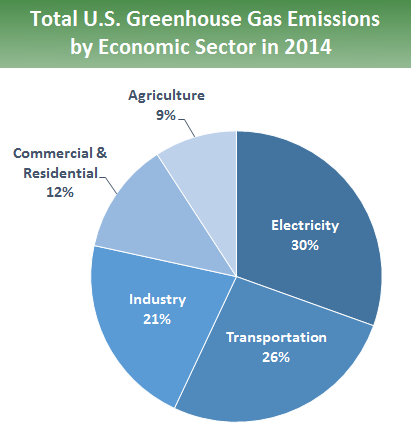 Total Emissions in 2014 = 6,870 Million Metric Tons of CO2 equivalent
*
Greenhouse gases trap heat and make the planet warmer. Human activities are responsible for almost all of the increase in greenhouse gases in the atmosphere over the last 150 years.1 The largest source of greenhouse gas emissions from human activities in the United States is from burning fossil fuels for electricity, heat, and transportation.
EPA tracks total U.S. emissions by publishing the Inventory of U.S. Greenhouse Gas Emissions and Sinks. This annual report estimates the total national greenhouse gas emissions and removals associated with human activities across the United States.
The primary sources of greenhouse gas emissions in the United States are:
- (30 percent of 2014 greenhouse gas emissions) – Electricity production generates the largest share of greenhouse gas emissions. Approximately 67 percent of our electricity comes from burning fossil fuels, mostly coal and natural gas.2
- (26 percent of 2014 greenhouse gas emissions) – Greenhouse gas emissions from transportation primarily come from burning fossil fuel for our cars, trucks, ships, trains, and planes. Over 90 percent of the fuel used for transportation is petroleum based, which includes gasoline and diesel.3
- (21 percent of 2014 greenhouse gas emissions) – Greenhouse gas emissions from industry primarily come from burning fossil fuels for energy, as well as greenhouse gas emissions from certain chemical reactions necessary to produce goods from raw materials.
- (12 percent of 2014 greenhouse gas emissions) – Greenhouse gas emissions from businesses and homes arise primarily from fossil fuels burned for heat, the use of certain products that contain greenhouse gases, and the handling of waste.
- (9 percent of 2014 greenhouse gas emissions) – Greenhouse gas emissions from agriculture come from livestock such as cows, agricultural soils, and rice production.
- (offset of 11 percent of 2014 greenhouse gas emissions) – Land areas can act as a sink (absorbing CO2 from the atmosphere) or a source of greenhouse gas emissions. In the United States, since 1990, managed forests and other lands have absorbed more CO2 from the atmosphere than they emit.
Emissions and Trends
Since 1990, U.S. greenhouse gas emissions have increased by about 7 percent. From year to year, emissions can rise and fall due to changes in the economy, the price of fuel, and other factors. In 2014, U.S. greenhouse gas emissions increased compared to 2013 levels. This increase was due to a number of factors, including: cold winter conditions resulting in an increase in fuel demand, especially in residential and commercial sectors; an increase in transportation emissions resulting from an increase in vehicle miles traveled; and an increase in industrial production across multiple sectors that also resulted in increases in industrial sector emissions.
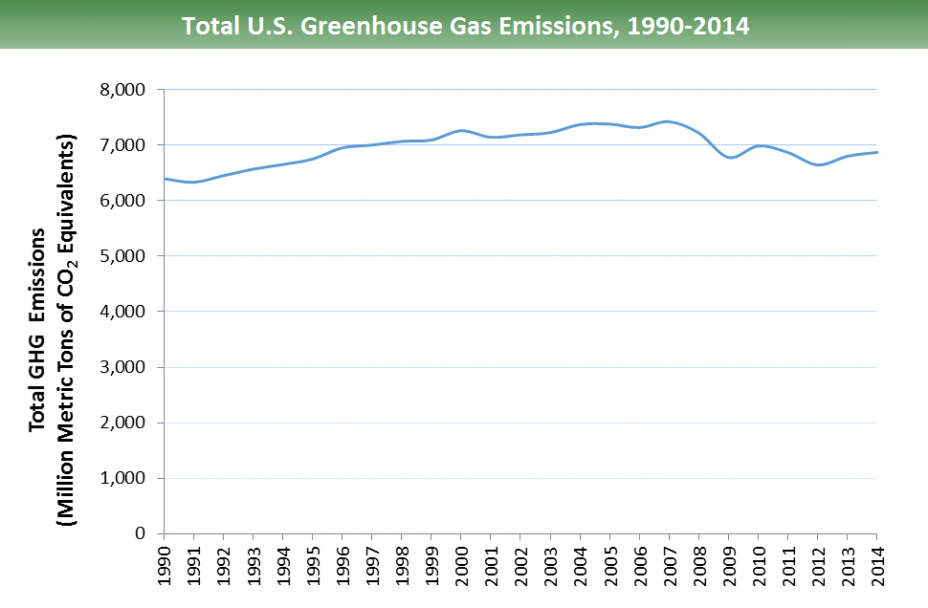 All emission estimates from the Inventory of U.S. Greenhouse Gas Emissions and Sinks: 1990–2014.
Larger image to save or print.
To learn about projected greenhouse gas emissions to 2020, visit the U.S. Climate Action Report 2014.(310 pp, 23 M, About PDF)
References
1 IPCC (2007). Summary for Policymakers. In: Climate Change 2007: The Physical Science Basis. Exit Contribution of Working Group I to the Fourth Assessment Report of the Intergovernmental Panel on Climate Change [Solomon, S., D. Qin, M. Manning, Z. Chen, M. Marquis, K.B. Averyt, M. Tignor and H.L. Miller (eds.)]. Cambridge University Press, Cambridge, United Kingdom and New York, NY, USA.
2 U.S. Energy Information Administration (2016). Electricity Explained - Basics.
3 Kahn Ribeiro, S., S. Kobayashi, M. Beuthe, J. Gasca, D. Greene, D. S. Lee, Y. Muromachi, P. J. Newton, S. Plotkin, D. Sperling, R. Wit, P. J. Zhou (2007). Transport and its infrastructure. In Climate Change 2007: Mitigation. Exit Contribution of Working Group III to the Fourth Assessment Report of the Intergovernmental Panel on Climate Change [B. Metz, O.R. Davidson, P.R. Bosch, R. Dave, L.A. Meyer (eds.)], Cambridge University Press, Cambridge, United Kingdom.
Electricity Sector Emissions
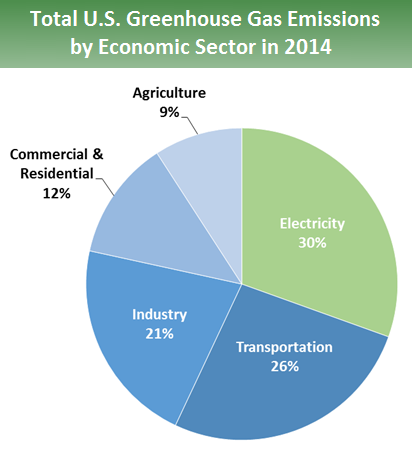 Total Emissions in 2014 = 6,870 Million Metric Tons of CO2 equivalent
*
Larger image to save or print.The Electricity sector involves the generation, transmission, and distribution of electricity. Carbon dioxide (CO2) makes up the vast majority of greenhouse gas emissions from the sector, but smaller amounts of methane (CH4) and nitrous oxide (N2O) are also emitted. These gases are released during the combustion of fossil fuels, such as coal, oil, and natural gas, to produce electricity. Less than 1 percent of greenhouse gas emissions from the sector come from sulfur hexafluoride (SF6), an insulating chemical used in electricity transmission and distribution equipment.
Greenhouse Gas Emissions in the Electricity Sector by Fuel Source
Coal combustion is generally more carbon intensive than burning natural gas or petroleum for electricity. Although coal accounts for about 77 percent of CO2 emissions from the sector, it represents about 39 percent of the electricity generated in the United States. About 27 percent of electricity generated in 2014 was generated using natural gas, an increase relative to 2013. Petroleum accounts for approximately 1 percent of electricity generation. The remaining generation comes from nuclear (about 19 percent) and renewable sources (about 13 percent), which include hydroelectricity, biomass, wind, and solar.1 These other sources usually release fewer greenhouse gas emissions than fossil fuel combustion, if any emissions at all.
Emissions and Trends
In 2014, the electricity sector was the largest source of U.S. greenhouse gas emissions, accounting for about 30 percent of the U.S. total. Greenhouse gas emissions from electricity have increased by about 12 percent since 1990 as electricity demand has grown and fossil fuels have remained the dominant source for generation.
To learn about projected greenhouse gas emissions to 2020, visit the U.S. Climate Action Report 2014(310 pp, 23 M, About PDF).
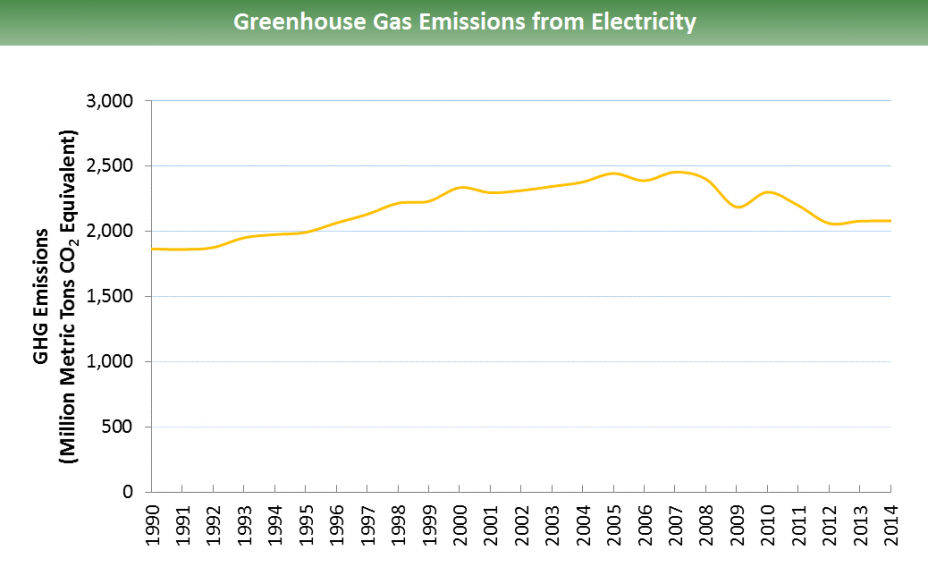 Note: All emission estimates from the Inventory of U.S. Greenhouse Gas Emissions and Sinks: 1990–2014.
Larger image to save or print.
Greenhouse Gas Emissions by Electricity End-Use
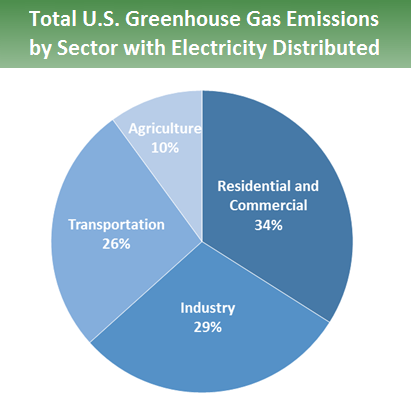 Note: All emission estimates from the Inventory of U.S. Greenhouse Gas Emissions and Sinks: 1990–2014.
Larger image to save or print.Electricity is consumed by other sectors—in homes, businesses, and factories. Therefore, it is possible to attribute the greenhouse gas emissions from electricity production to the sectors that use the electricity. Looking at greenhouse gas emissions by end-use sector can help us understand energy demand across sectors and changes in energy use over time.
When emissions from electricity are allocated to the end-use sector, industrial activities account for a much larger share of U.S. greenhouse gas emissions. Emissions from commercial and residential buildings also increase substantially when emissions from electricity are included, due to their relatively large share of electricity consumption (e.g., lighting and appliances).
Reducing Emissions from Electricity
There are a variety of opportunities to reduce greenhouse gas emissions associated with electricity generation, transmission, and distribution. The table shown below categorizes these opportunities and provides examples. For a more comprehensive list, see Chapter 7 of the Contribution of Working Group III to the Fifth Assessment Report of the Intergovernmental Panel on Climate Change. Exit
Under the president's Climate Action Plan, EPA is taking action to reduce emissions from power plants. Learn More.
| Type | How Emissions Are Reduced | Examples |
|---|---|---|
| Increased Efficiency of Power Plants and Fuel Switching | Increasing efficiency of existing power plants by using advanced technologies or substituting fuels that combust more efficiently. |
|
| Renewable Energy | Using renewable energy sources rather than fossil fuel to generate electricity. | Increasing the share of total electricity generated from wind, solar, hydro, and geothermal sources and from certain biofuel sources. |
| Increased Energy Efficiency (end-use) | Reducing energy demand by increasing efficiency and conservation in homes, businesses, and industry. | EPA's ENERGY STAR® partners removed over 300 million metric tons of greenhouse gases in 2014 alone, and saved consumers and businesses over $34 billion on their utility bills. |
| Nuclear Energy | Generating electricity from nuclear processes rather than the combustion of fossil fuels. | Building nuclear power plants as fossil fuel power plants are retired. |
| Carbon Capture Sequestration and Storage (CCS) | Capturing CO2 as a byproduct of fossil fuel combustion before it enters the atmosphere and then transferring the CO2 to a long-term storage area, such as an underground geologic formation. | Capturing CO2 from the stacks of a coal-fired power plant, and then transferring the CO2 via pipeline to a nearby abandoned oil field where the CO2 is injected underground. Learn more about CCS. |
Reference
1. U.S. Energy Information Administration (2014). Electricity Explained - Basics.
Transportation Sector Emissions
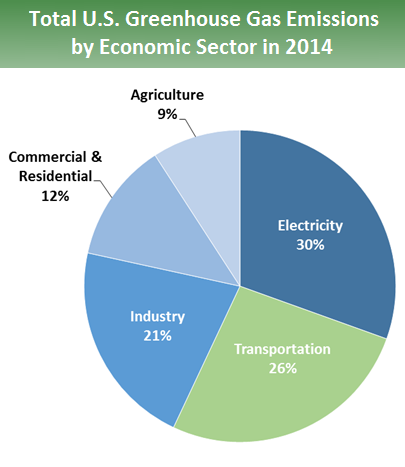 Total Emissions in 2014 = 6,870 Million Metric Tons of CO2 equivalent
*
Larger image to save or print.The Transportation sector includes the movement of people and goods by cars, trucks, trains, ships, airplanes, and other vehicles. The majority of greenhouse gas emissions from transportation are carbon dioxide (CO2) emissions resulting from the combustion of petroleum-based products, like gasoline, in internal combustion engines. The largest sources of transportation-related greenhouse gas emissions include passenger cars and light-duty trucks, including sport utility vehicles, pickup trucks, and minivans. These sources account for over half of the emissions from the sector. The remainder of greenhouse gas emissions comes from other modes of transportation, including freight trucks, commercial aircraft, ships, boats, and trains, as well as pipelines and lubricants.
Relatively small amounts of methane (CH4) and nitrous oxide (N2O) are emitted during fuel combustion. In addition, a small amount of hydrofluorocarbon (HFC) emissions are included in the Transportation sector. These emissions result from the use of mobile air conditioners and refrigerated transport.
Emissions and Trends
In 2014, greenhouse gas emissions from transportation accounted for about 26 percent of total U.S. greenhouse gas emissions, making it the second largest contributor of U.S. greenhouse gas emissions after the . Greenhouse gas emissions from transportation have increased by about 17 percent since 1990. This historical increase is largely due to increased demand for travel and the limited gains in fuel efficiency across the U.S. vehicle fleet. The number of vehicle miles traveled by passenger cars and light-duty trucks increased 37 percent from 1990 to 2014. The increase in travel miles is attributed to several factors, including population growth, economic growth, urban sprawl, and low fuel prices during the beginning of this period. Between 1990 and 2004, average fuel economy among new vehicles sold annually declined, as sales of light-duty trucks increased. However, new vehicle fuel economy began to improve in 2005, largely due to a lower light-duty truck market share and higher fuel economy standards.
Learn more about Greenhouse Gas Emissions from Transportation. To learn about projected greenhouse gas emissions to 2020, visit the U.S. Climate Action Report 2014(310 pp, 23 M, About PDF).
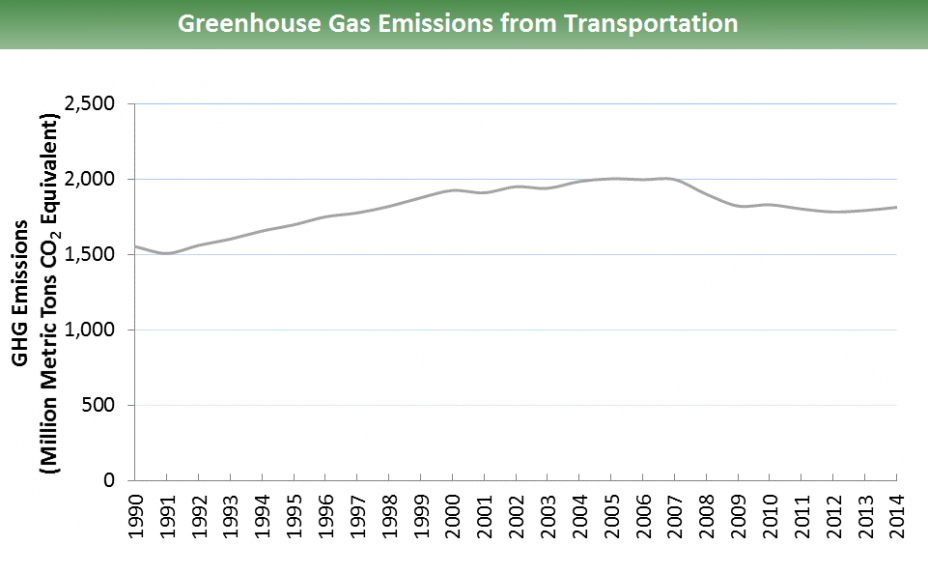 Note: Emissions involved in the consumption of electricity for transportation activities are included above, but not shown separately (as was done for other sectors). These indirect emissions are negligible, accounting for less than 1 percent of the total emissions shown in the graph.
Note: All emission estimates from the Inventory of U.S. Greenhouse Gas Emissions and Sinks: 1990–2014.
Larger image to save or print.
Reducing Emissions from Transportation
There are a variety of opportunities to reduce greenhouse gas emissions associated with transportation. The table shown below categorizes these opportunities and provides examples. For a more comprehensive list, see Chapter 8 of the Contribution of Working Group III to the Fifth Assessment Report of the Intergovernmental Panel on Climate Change. Exit
EPA's vehicle greenhouse gas rules will save consumers $1.7 trillion at the pump by 2025, and eliminate 6 billion metric tons of greenhouse gas pollution.
| Type | How Emissions Are Reduced | Examples |
|---|---|---|
| Fuel Switching | Using fuels that emit less CO2 than fuels currently being used. Alternative sources can include biofuels; hydrogen; electricity from renewable sources, such as wind and solar; or fossil fuels that are less CO2-intensive than the fuels that they replace. Learn more about Alternative and Renewable Fuels. |
|
| Improving Fuel Efficiency with Advanced Design, Materials, and Technologies | Using advanced technologies, design, and materials to develop more fuel-efficient vehicles. Learn about EPA's vehicle greenhouse gas rules. |
|
| Improving Operating Practices | Adopting practices that minimize fuel use. Improving driving practices and vehicle maintenance. Learn about how the freight transportation industry can reduce emissions through EPA's SmartWay Program. |
|
| Reducing Travel Demand | Employing urban planning to reduce the number of miles that people drive each day. Learn about EPA's Smart Growth Program. Reducing the need for driving through travel efficiency measures such as commuter, biking, and pedestrian programs. See a list of links to state, local, and regional travel-efficiency programs. |
|
Industry Sector Emissions
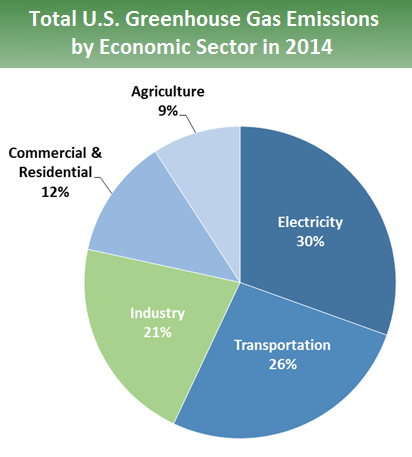 Total Emissions in 2014 = 6,870 Million Metric Tons of CO2 equivalent
*
Larger image to save or print.The Industry sector produces the goods and raw materials we use every day. The greenhouse gases emitted during industrial production are split into two categories: direct emissions that are produced at the facility, and indirect emissions that occur off site, but are associated with the facility's use of energy.
Direct emissions are produced by burning fuel for power or heat, through chemical reactions, and from leaks from industrial processes or equipment. Most direct emissions come from the consumption of fossil fuels for energy. A smaller amount, roughly a third, come from leaks from natural gas and petroleum systems, the use of fuels in production (e.g., petroleum products used to make plastics), and chemical reactions during the production of chemicals, iron and steel, and cement.
Indirect emissions are produced by burning fossil fuel at a power plant to make electricity, which is then used by an industrial facility to power industrial buildings and machinery.
More information about facility-level emissions from large industrial sources is available through EPA's Greenhouse Gas Reporting Program's data publication tool. National-level information about emissions from industry as a whole can be found in the sections on Fossil Fuel Combustion and the Industrial Processes chapter in the Inventory of U.S. Greenhouse Gas Emissions and Sinks.
Emissions and Trends
In 2014, direct industrial greenhouse gas emissions accounted for approximately 21 percent of total U.S. greenhouse gas emissions, making it the third largest contributor to U.S. greenhouse gas emissions, after the and sectors. If both direct and indirect emissions associated with electricity use are included, industry's share of total U.S. greenhouse gas emissions in 2014 was 29 percent, making it the largest contributor of greenhouse gases of any sector. Greenhouse gas emissions from industry have declined by almost 10 percent since 1990, while emissions from most other sectors have increased.
To learn about projected greenhouse gas emissions to 2020, visit the U.S. Climate Action Report 2014.(310 pp, 23 M, About PDF)
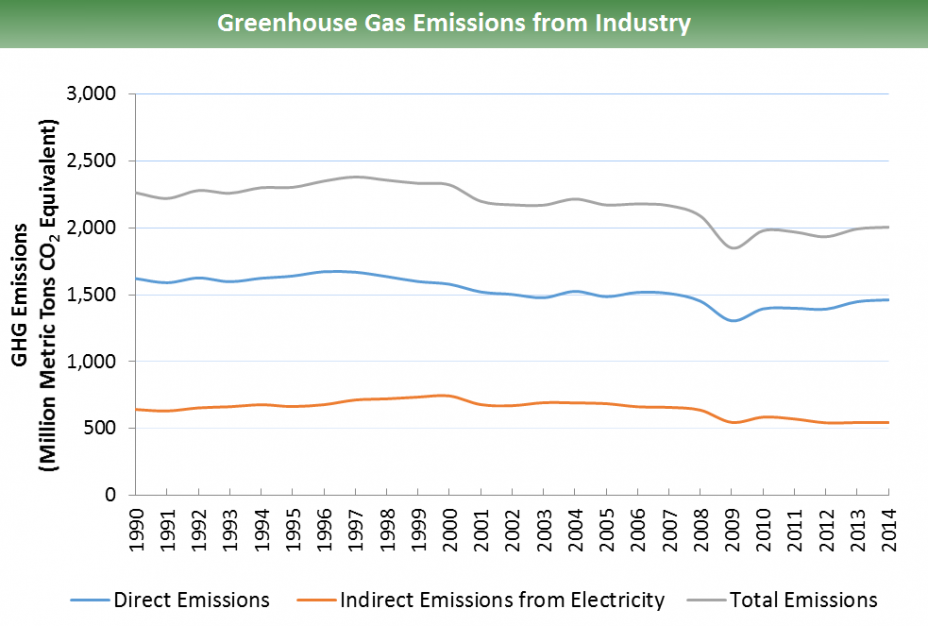 All emission estimates from the Inventory of U.S. Greenhouse Gas Emissions and Sinks: 1990–2014.
Larger image to save or print.
Reducing Emissions from Industry
There are a wide variety of industrial activities that cause greenhouse gas emissions, and many opportunities to reduce them. The table shown below provides some examples of opportunities for industry to reduce emissions. For a more comprehensive list, see Chapter 10 of the Contribution of Working Group III to the Fifth Assessment Report of the Intergovernmental Panel on Climate Change. Exit
| Type | How Emissions Are Reduced | Examples |
|---|---|---|
| Energy Efficiency | Upgrading to more efficient industrial technology. EPA's ENERGY STAR® program helps industries become more energy-efficient. |
Identifying the ways that manufacturers(87 pp, 1 M, About PDF) can use less energy to light and heat factories or to run equipment. |
| Fuel Switching | Switching to fuels that result in less CO2 emissions but the same amount of energy, when combusted. | Using natural gas instead of coal to run machinery. |
| Recycling | Producing industrial products from materials that are recycled or renewable, rather than producing new products from raw materials. | Using scrap steel and scrap aluminum as opposed to smelting new aluminum or forging new steel. |
| Training and Awareness |
Making companies and workers aware of the steps to reduce or prevent emissions leaks from equipment. |
Instituting handling policies and procedures for perfluorocarbons (PFCs), hydrofluorocarbons (HFCs), and sulfur hexafluoride (SF6) that reduce occurrences of accidental releases and leaks from containers and equipment. |
Commercial and Residential Sector Emissions
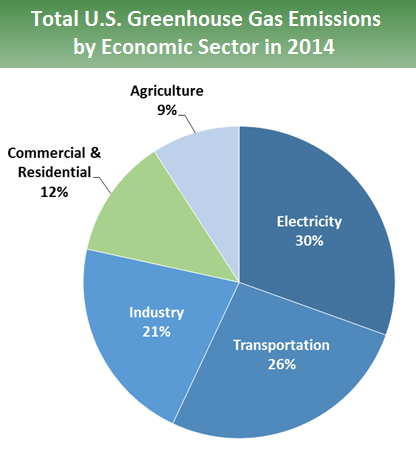 Total Emissions in 2014 = 6,870 Million Metric Tons of CO2 equivalent
*
Larger image to save or print.The residential and commercial sectors include all homes and commercial businesses (excluding agricultural and industrial activities). Greenhouse gas emissions from this sector come from fossil fuel combustion for heating and cooking needs, management of waste and wastewater, and leaks from refrigerants in homes and businesses. Indirect emissions, resulting from electricity consumed by homes and businesses, are discussed on the page.
Residential and commercial activities contribute to emissions in a variety of ways:
- Combustion of natural gas and petroleum products for heating and cooking needs emits carbon dioxide (CO2), methane (CH4), and nitrous oxide (N2O). Emissions from natural gas consumption represent about 81 percent of the direct fossil fuel CO2 emissions from the residential and commercial sectors. Coal consumption is a minor component of energy use in both of these sectors.
- Organic waste sent to landfills emits CH4.
- Wastewater treatment plants emit CH4 and N2O.
- Fluorinated gases (mainly hydrofluorocarbons, or HFCs) used in air conditioning and refrigeration systems can be released during servicing or from leaking equipment.
More national-level information about emissions from the residential and commercial sectors can be found in the U.S. Inventory's Energy and Trends chapters.
Emissions and Trends
In 2014, direct greenhouse gas emissions from homes and businesses accounted for approximately 12 percent of total U.S. greenhouse gas emissions. Greenhouse gas emissions from homes and businesses have generally been increasing since 1990, but vary from year to year based on short-term fluctuations in energy consumption caused by weather conditions. Total residential and commercial greenhouse gas emissions in 2014 have increased by about 11 percent since 1990. Greenhouse gas emissions from on-site energy combustion in homes and businesses have increased by about 11 percent since 1990. Additionally, indirect emissions from use by homes and businesses have increased by 27 percent since 1990, due to increasing electricity consumption for lighting, heating, air conditioning, and appliances.
To learn about projected greenhouse gas emissions to 2020, visit the U.S. Climate Action Report 2014.(310 pp, 23 M, About PDF)
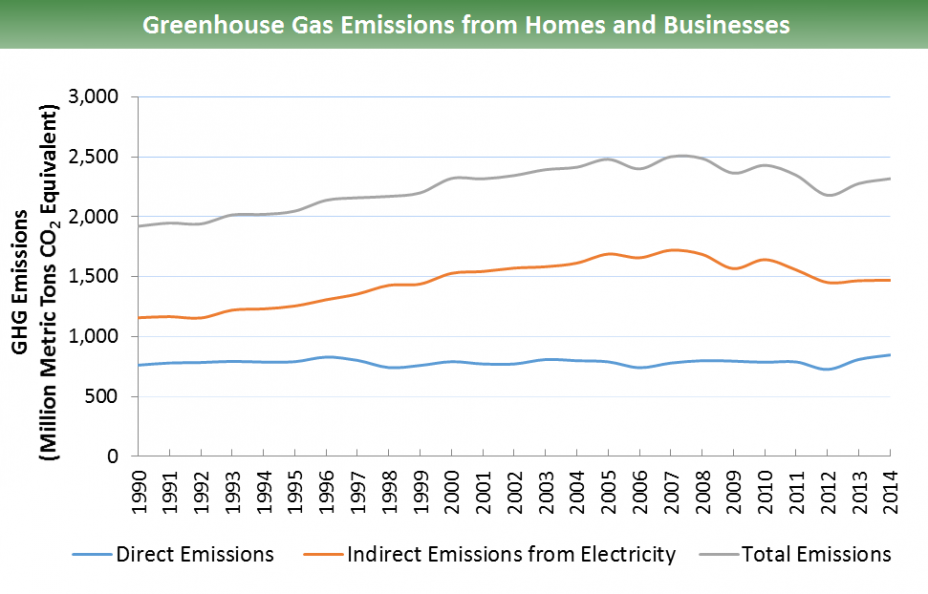 All emission estimates from the Inventory of U.S. Greenhouse Gas Emissions and Sinks: 1990–2014.
Larger image to save or print.
Reducing Emissions from Homes and Businesses
The table shown below provides some examples of opportunities to reduce emissions from homes and businesses. For a more comprehensive list of options and a detailed assessment of how each option affects different gases, see Chapter 9 and Chapter 12 of the Contribution of Working Group III to the Fifth Assessment Report of the Intergovernmental Panel on Climate Change. Exit
| Type | How Emissions Are Reduced | Examples |
|---|---|---|
| Homes and Commercial Buildings | Reducing energy use through energy efficiency. | Homes and commercial buildings use large amounts of energy for heating, cooling, lighting, and other functions. "Green building" techniques and retrofits can allow new and existing buildings to use less energy to accomplish the same functions, leading to fewer greenhouse gas emissions. Techniques to improve building energy efficiency include better insulation; more energy-efficient heating, cooling, ventilation, and refrigeration systems; efficient fluorescent lighting; passive heating and lighting to take advantage of sunlight; and the purchase of energy-efficient appliances and electronics. Learn more about ENERGY STAR®. |
| Wastewater Treatment | Making water and wastewater systems more energy-efficient. | Drinking water and wastewater systems account for approximately 3 percent to 4 percent of energy use in the United States. Studies estimate potential savings of 15 percent to 30 percent that are "readily achievable" in water and wastewater plants.1 Learn more about Energy Efficiency for Water and Wastewater Utilities. |
| Waste Management | Reducing solid waste sent to landfills. Capturing and using methane produced in current landfills. |
Landfill gas is the natural byproduct of the decomposition of solid waste in landfills. It primarily consists of CO2 and CH4. Well established, low-cost methods to reduce greenhouse gases from consumer waste exist, including recycling programs, waste reduction programs, and landfill methane capture programs.
|
| Refrigeration | Reducing leakage from refrigeration equipment. Using refrigerants with lower global warming potentials. |
Commonly used refrigerants include ozone-depleting hydrochlorofluorocarbon (HCFC) refrigerants, often HCFC-22, and blends consisting entirely or primarily of hydrofluorocarbons (HFCs), both of which are potent greenhouse gases. In recent years there have been several advancements in refrigeration technology that can help food retailers reduce both refrigerant charges and refrigerant emissions. Learn more about EPA's GreenChill Program to reduce greenhouse gas emissions from commercial refrigerators. |
References
1 EPA (2012). Energy Efficiency for Water and Wastewater Utilities. Accessed 03/13/2012
Agriculture Sector Emissions
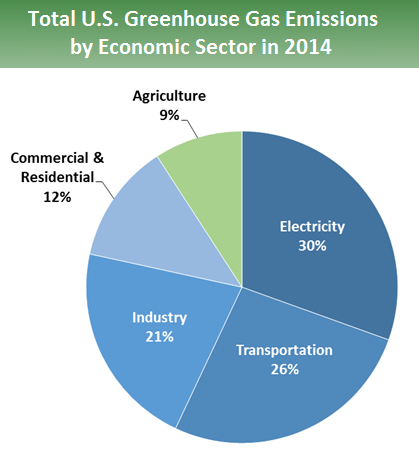 Total Emissions in 2014 = 6,870 Million Metric Tons of CO2 equivalent
*
Agricultural activities – the cultivation of crops and livestock for food – contribute to emissions in a variety of ways:
- Various management practices for agricultural soils can lead to production and emission of nitrous oxide (N2O). The large number of different activities that can contribute to N2O emissions from agricultural lands range from fertilizer application to methods of irrigation and tillage. Management of agricultural soils accounts for over half of the emissions from the Agriculture sector.*
- Livestock, especially cattle, produce methane (CH4) as part of their digestion. This process is called enteric fermentation, and it represents almost one third of the emissions from the Agriculture sector.
- The way in which manure from livestock is managed also contributes to CH4 and N2O emissions. Manure storage methods and the amount of exposure to oxygen and moisture can affect how these greenhouse gases are produced. Manure management accounts for about 14 percent of the total greenhouse gas emissions from the Agriculture sector in the United States.
- Smaller sources of emissions include rice cultivation, which produces CH4, and burning crop residues, which produce CH4 and N2O.
More national-level information about emissions from agriculture can be found in the agriculture chapter in the Inventory of U.S. Greenhouse Gas Emissions and Sinks.
* Management of agricultural soils can also lead to emissions of carbon dioxide (CO2). However, these emissions are included under the .
Emissions and Trends
In 2014, greenhouse gas emissions from agriculture accounted for approximately 9 percent of total U.S. greenhouse gas emissions. Greenhouse gas emissions from agriculture have increased by approximately 11 percent since 1990. One driver for this increase has been the 54 percent growth in combined CH4 and N2O emissions from livestock manure management systems, reflecting the increased use of emission-intensive liquid systems over this time period. Emissions from agricultural soil management have also increased by about 5 percent since 1990. Emissions from other agricultural sources have either remained flat or changed by a relatively small amount since 1990.
To learn about projected greenhouse gas emissions to 2020, visit the U.S. Climate Action Report 2014.(310 pp, 23 M, About PDF)
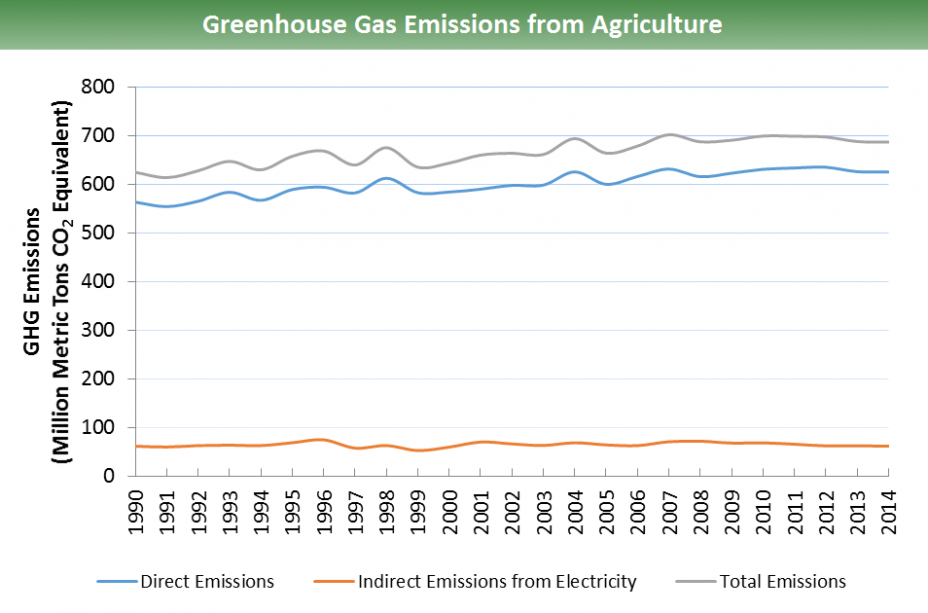 All emission estimates from the Inventory of U.S. Greenhouse Gas Emissions and Sinks: 1990–2014.
Larger image to save or print.
Reducing Emissions from Agriculture
The table shown below provides some examples of opportunities to reduce emissions from agriculture. For a more comprehensive list of options and a detailed assessment of how each option affects different gases, see Chapter 11 of the Contribution of Working Group III to the Fifth Assessment Report of the Intergovernmental Panel on Climate Change. Exit
| Type | How Emissions Are Reduced | Examples |
|---|---|---|
| Land and Crop Management | Adjusting the methods for managing land and growing crops. |
|
| Livestock Management | Adjusting feeding practices and other management methods to reduce the amount of CH4 resulting from enteric fermentation. | Improving pasture quality to increase animal productivity, which can reduce the amount of CH4 emitted per unit of animal product. Also, increased productivity can be accomplished through breeding. |
| Manure Management |
|
|
Land Use, Land-Use Change, and Forestry Sector Emissions
Plants absorb carbon dioxide (CO2) from the atmosphere as they grow, and they store some of the carbon throughout their lifetime. Soils can also store CO2, depending on how the soil is managed. This storage of carbon in plants and soils is called biological carbon sequestration. Because biological sequestration takes CO2 out of the atmosphere, it is also called a greenhouse gas "sink."
Emissions or sequestration of CO2 can occur as land uses change. For example, CO2 is exchanged between the atmosphere and the plants and soils on land as former cropland is converted into grassland, as new areas are cultivated and become cropland, or as forests grow. In addition, using biological feedstocks (such as energy crops or wood) for purposes such as electricity generation, input to processes that create liquid fuels, or building materials can lead to emissions or sequestration.
In the United States overall, since 1990, land use, land-use change, and forestry activities have resulted in more removal of CO2 from the atmosphere than emissions. Because of this, the Land Use, Land-Use Change, and Forestry (LULUCF) sector in the United States is considered a net sink, rather than a source, of CO2 over this period. In many areas of the world, the opposite is true: In countries where large areas of forest land are cleared, often for agricultural purposes or for settlements, the LULUCF sector can be a net source of greenhouse gas emissions.
- More national-level information about land use, land-use change, and forestry is available from the Land Use, Land-Use Change, and Forestry chapter in the Inventory of U.S. Greenhouse Gas Emissions and Sinks.
- See EPA's Global Greenhouse Gas emissions page for more information about global greenhouse gas emissions from land use and forestry activities.
- For more information about global emissions from land use and forestry activities, see the Contribution of Working Group III to the Fifth Assessment Report of the Intergovernmental Panel on Climate Change. Exit
Emissions and Trends
In 2014, the net CO2 removed from the atmosphere from the LULUCF sector offset about 11 percent of total U.S. greenhouse gas emissions. Forests (including vegetation, soils, and harvested wood) accounted for approximately 87 percent of the total 2014 LULUCF CO2 removals.
The net carbon sequestration by the LULUCF sector has increased by about 5 percent since 1990, largely as a result of changes in the land area of forests and improved forest management.
To learn about projected greenhouse gas emissions to 2020, visit the U.S. Climate Action Report 2014.(310 pp, 23 M, About PDF)
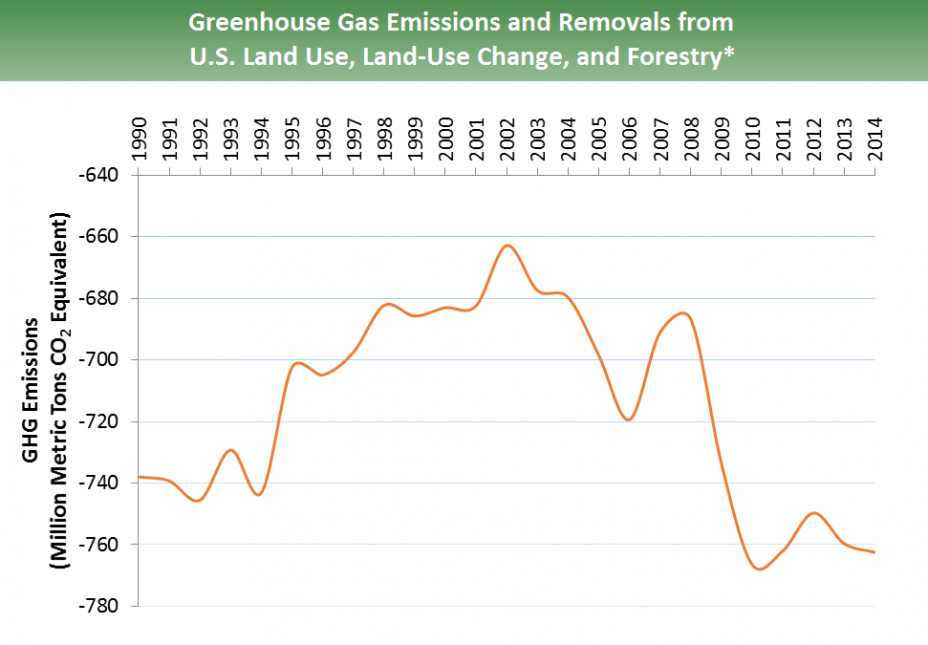 *Note: The LULUCF sector is a net "sink" of emissions in the United States (e.g., more greenhouse gas emissions are sequestered than emitted from land use activities), so net greenhouse gas emissions from LULUCF are negative.
All emission estimates from the Inventory of U.S. Greenhouse Gas Emissions and Sinks: 1990–2014.
Larger image to save or print.
Reducing Emissions and Enhancing Sinks from Land Use, Land-Use Change, and Forestry
In the LULUCF sector, opportunities exist to reduce emissions and increase the potential to sequester carbon from the atmosphere by enhancing sinks. The table shown below provides some examples of opportunities for both reducing emissions and enhancing sinks. For a more comprehensive list, see Chapter 11 of the Contribution of Working Group III to the Fifth Assessment Report of the Intergovernmental Panel on Climate Change. Exit
| Type | How Emissions Are Reduced or Sinks Are Enhanced Examples | Examples |
|---|---|---|
| Change in Uses of Land | Increasing carbon storage by using land differently or maintaining carbon storage by avoiding land degradation. |
|
| Changes in Land Management Practices | Improving management practices on existing land-use types. |
|
