Climate Change Indicators: Snow Cover
This indicator measures the amount of land in North America that is covered by snow.
-
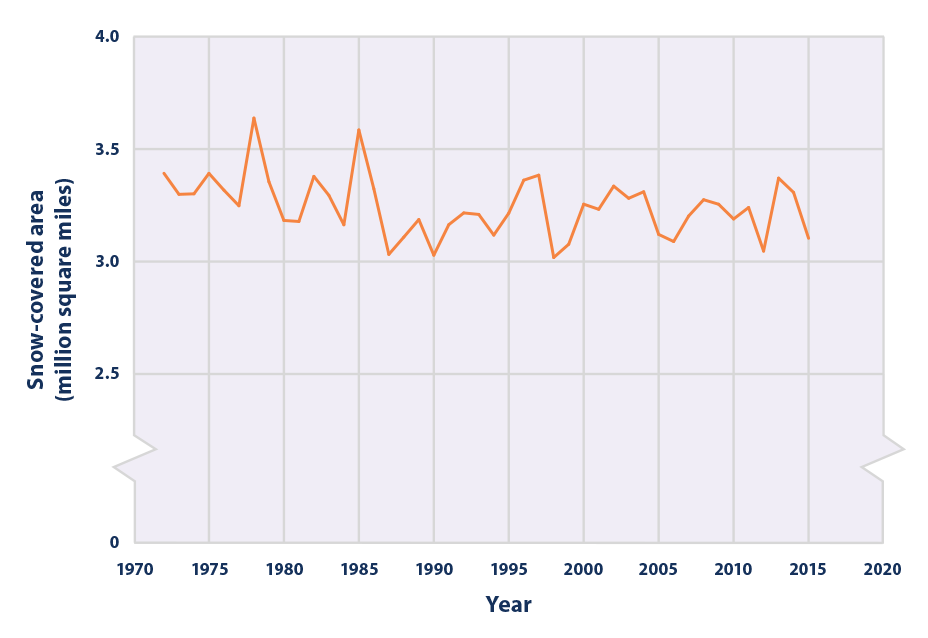
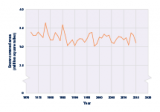
This graph shows the average area covered by snow in a given calendar year, based on an analysis of weekly maps. The area is measured in square miles. These data cover all of North America (not including Greenland).
Data source: Rutgers University Global Snow Lab, 20162
Web update: August 2016 -
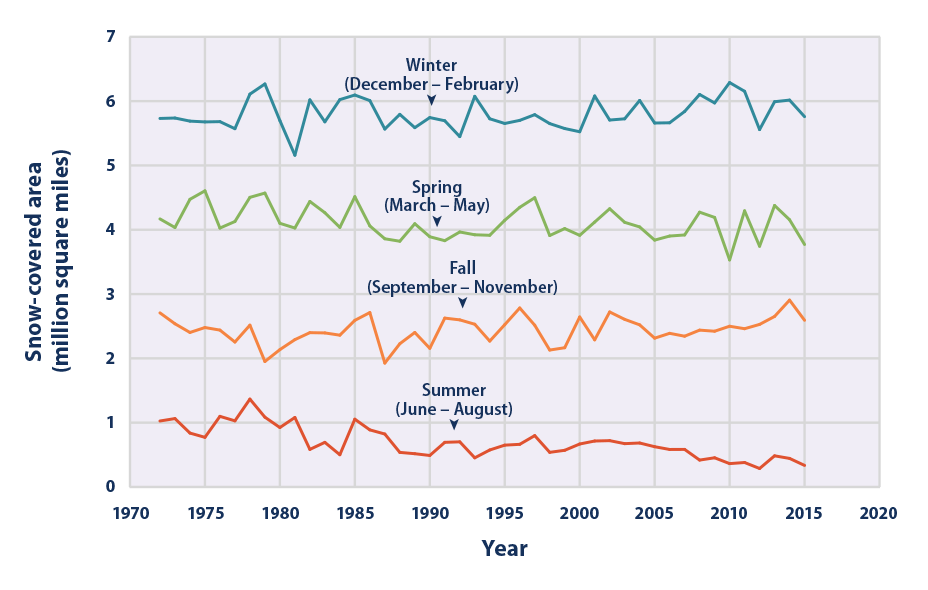
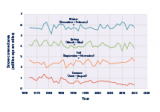
This graph shows the average area covered by snow during spring (March–May), summer (June–August), fall (September–November), and winter (December–February), based on an analysis of weekly maps. The area is measured in square miles. These data cover all of North America (not including Greenland).
Data source: Rutgers University Global Snow Lab, 20163
Web update: August 2016 -
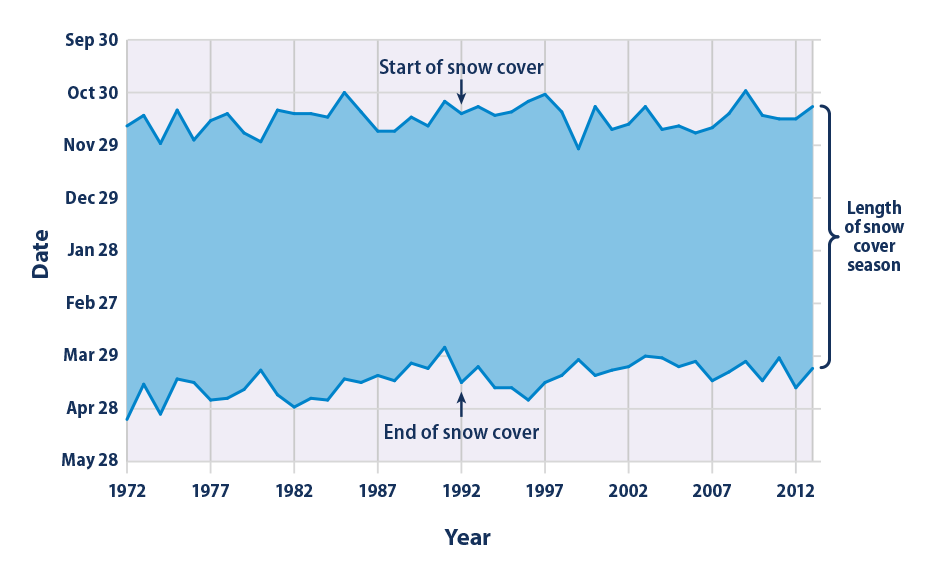
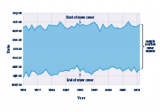
This figure shows the timing of each year’s snow cover season in the contiguous 48 states and Alaska, based on an average of all parts of the country that receive snow every year. The shaded band spans from the first date of snow cover until the last date of snow cover.
Data source: NOAA, 20154
Web update: August 2016
Key Points
- When averaged over the entire year, snow covered an average of 3.24 million square miles of North America during the period from 1972 to 2015 (see Figure 1).
- The extent of snow cover has varied from year to year. The average area covered by snow has ranged from 3.0 million to 3.6 million square miles, with the minimum value occurring in 1998 and the maximum in 1978 (see Figure 1).
- Between 1972 and 2015, the average extent of North American snow cover decreased at a rate of about 3,300 square miles per year. The average area covered by snow during the most recent decade (2006–2015) was 3.21 million square miles, which is about 4 percent smaller than the average extent during the first 10 years of measurement (1972–1981)—a difference of 122,000 square miles, or approximately an area the size of New Mexico (see Figure 1).
- Decreases in snow cover have largely occurred in spring and summer, whereas fall and winter snow cover have remained fairly steady over the time period studied (see Figure 2). Spring and summer snow cover can have a particularly important influence on water supplies.
- Since 1972, the U.S. snow cover season has become shorter by nearly two weeks, on average (see Figure 3). By far the largest change has taken place in the spring, with the last day of snow shifting earlier by 19 days since 1972. In contrast, the first date of snow cover in the fall has remained relatively unchanged.
Background
Snow cover refers to the amount of land covered by snow at any given time. Naturally, it is influenced by the amount of precipitation that falls as snow. Air temperature also plays a role because it determines whether precipitation falls as snow or rain, and it affects the rate at which snow on the ground melts. As temperature and precipitation patterns change, so can the overall area covered by snow.
Snow cover is not just something that is affected by climate change; it also exerts an influence on climate. Because snow is white, it absorbs only a small portion of the sunlight that hits it (10 to 20 percent in the case of fresh snow), and it reflects the rest back to space. In contrast, darker surfaces such as bare ground and open water absorb the majority of the energy they receive and heat up more quickly. In this way, the overall amount of snow cover affects patterns of heating and cooling over the Earth’s surface. More snow means more energy reflects back to space, resulting in cooling, while less snow cover means more energy is absorbed at the Earth’s surface, resulting in warming.
On a more local scale, snow cover is important for many plants and animals. For example, some plants and animals rely on a protective blanket of snow to insulate them from sub-freezing winter temperatures. Humans and ecosystems also rely on snowmelt to replenish streams and groundwater. Snow cover also keeps the soil moist, so if the snow melts away earlier in the spring, the soil may dry out sooner, which can stress plants and increase the risk of wildfire.1
About the Indicator
This indicator tracks the area covered by snow since 1972, based on maps generated by analyzing satellite images collected by the National Oceanic and Atmospheric Administration. Figure 1 was created by analyzing weekly maps to determine the total extent of snow cover, then averaging the weekly observations together to get a value for each year. Figure 2 uses the same method, but with average snow cover calculated for each season: spring (defined as March–May), summer (June–August), fall (September–November), and winter (December–February). These two figures cover all of North America, not including Greenland. Figure 3 focuses on the contiguous 48 states plus Alaska. It shows the average date when snow first starts to cover the ground in the fall, the average last date of snow cover in the spring, and the length of time between them. These snow cover season dates have been averaged over all parts of the country that regularly receive snow.
Indicator Notes
Although satellite-based snow cover maps are available starting in the mid-1960s, some of the early years are missing data from several weeks during the summer, which would lead to an inaccurate annual average. Thus, the indicator is restricted to 1972 and later, with all years having a full set of data.
Data Sources
The data for this indicator were provided by the Rutgers University Global Snow Lab, which posts data online at: http://climate.rutgers.edu/snowcover, and the National Oceanic and Atmospheric Administration’s National Environmental Satellite, Data, and Information Service, which collects satellite measurements and compiles maps at: www.nesdis.noaa.gov.
Technical Documentation
References
1 Harpold, A.A., and N.P. Molotch. 2015. Sensitivity of soil water availability to changing snowmelt timing in the western U.S. Geophysical Research Letters 42(19):8011–8020.
2 Rutgers University Global Snow Lab. 2016. Area of extent data: North America (no Greenland). Accessed January 2016. http://climate.rutgers.edu/snowcover.
3 Rutgers University Global Snow Lab. 2016. Area of extent data: North America (no Greenland). Accessed January 2016. http://climate.rutgers.edu/snowcover.
4 NOAA (National Oceanic and Atmospheric Administration). 2015. Snow cover maps. Accessed November 2015. ftp://eclipse.ncdc.noaa.gov/pub/cdr/snowcover.

